
Case Studies
MapCraft Labs supports policy analysis and planning processes nationwide. These are just a few examples.
MapCraft Labs supports policy analysis and planning processes nationwide. These are just a few examples.

Understanding California’s housing underproduction
California has seen housing supply increase roughly 150,000 homes per year recently, far slower than what is required to meet the state’s 10-year housing production targets. While some jurisdictions in California have seen vast increases in supply, other jurisdictions have seen little or no housing production in years, perhaps because local policies stand in the way. Modifying prohibitive local policies could enable new housing development in California. Identifying where housing supply falls short of the real estate market’s potential allows advocates and policymakers to target policy interventions effectively.
To better understand the scale and geography of California’s housing production opportunities, California YIMBY approached MapCraft to study housing production rates across the state. To do this, we estimated a “conversion rate” for each city and county that compared historical rates of housing permitting to potential market-feasible housing development opportunities, assuming no limitations due to zoning. For example, a jurisdiction might have permitted 1,000 housing units last year while having an estimated 100,000 zoning-free market-feasible housing development opportunities on sites that were not environmentally encumbered, which would amount to a 1% conversion rate.
Housing conversion rates would need to double across the state to meet the state’s housing targets. Yet, more than 150 jurisdictions convert housing development opportunities at a rate below the already low statewide average. In fact, more than 40 jurisdictions convert housing development opportunities into new units at rates that are less than one-tenth the statewide average. Improvement is needed everywhere, but especially in these jurisdictions.
Relatively poor performing cities were concentrated in the San Francisco Bay Area and Greater Los Angeles, two regions with strong housing markets. The state’s largest cities underbuild housing relative to statewide targets, but they build housing at higher rates than most smaller California cities.
While public lands and environmental hazards restrict development in many parts of the state, California still has ample market-feasible development opportunities—if only policymakers will allow it to be built.


Reimagining equitable station planning in Seattle

In 2016, Seattle-area voters approved a 60-mile transit system expansion, including new light rail routes connecting the West Seattle and Ballard neighborhoods to downtown Seattle. Sound Transit set out to incorporate station planning concerns—including equitable TOD, new job capacity, and redevelopment potential—early in the planning process for these two projects. To help prioritize routes and station alternatives, the project team relied on MapCraft to analyze TOD potential in six station areas.
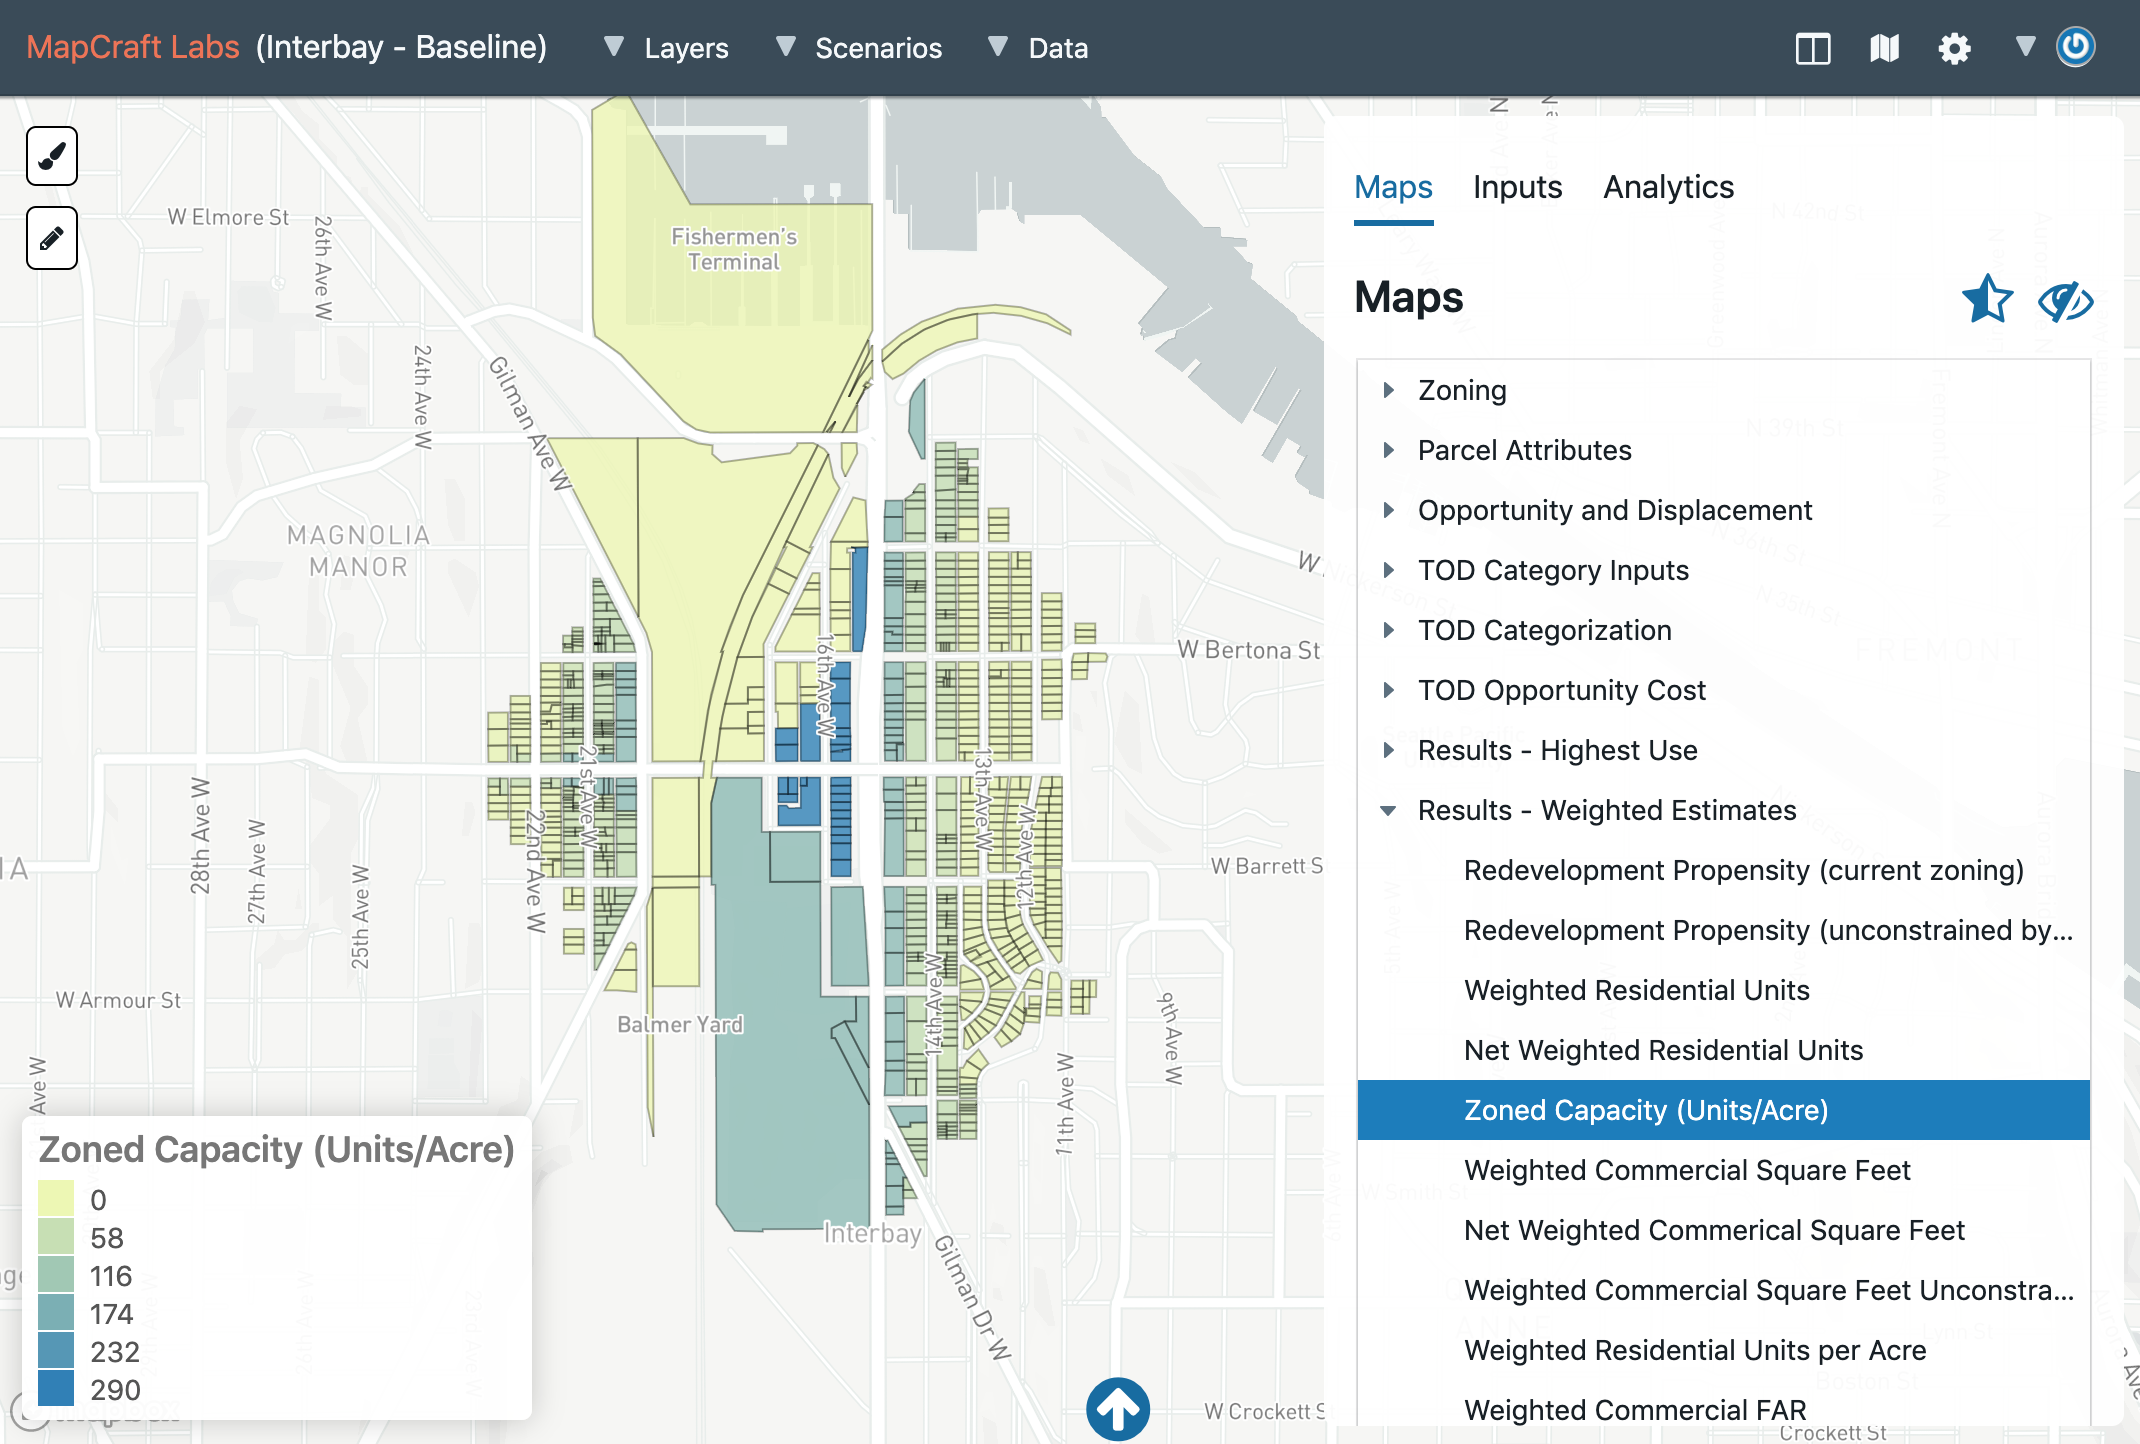
The Sound Transit implementation of MapCraft uses a variety of data to categorize TOD opportunities. For example, the MapCraft Lab identifies sites suitable for agency-led TOD as well as possible targets for affordable housing preservation. To do so, MapCraft calculates the financial feasibility of more than one hundred building prototypes—including single-family, multifamily, mixed-use, industrial, office, and hotel—on each parcel in the station areas. Users can modify assumptions about market conditions and zoning to see how development outcomes might change.
Sound Transit continues to plan the light rail project, now with a deeper understanding of the potential TOD opportunities, both agency-led and community-led, that exist in the corridor.

Evaluating the housing capacity enabled by SB9
In recent years, California lawmakers have proposed a number of legislative changes to address the state’s ongoing housing shortage and affordability crisis. Many bills contemplated allowing modest increases in smaller-sized housing developments in single-family neighborhoods, but their potential impact, both in magnitude and distribution, was unclear.
To illuminate how such bills could change housing supply in California, MapCraft partnered with the Terner Center for Housing and Innovation at UC Berkeley in 2021 to analyze the potential impacts of California Senate Bill 9 prior to its passage into law, which legalized duplexes and lot splits on single-family zones in California as of January 1st, 2022.
We evaluated the potential impact of SB 9 on new housing supply by modeling the financial feasibility of new home construction on eligible parcels in California. We estimated that the bill could increase the number of potential new market-feasible homes by 700,000 statewide. While a step towards alleviating the state’s affordability crisis, the new capacity enabled by SB 9 would represent only a fraction of the overall supply needed.
Our analysis was cited in news coverage by the LA Times, New York Times, San Francisco Chronicle, Vox, Slate, Bloomberg, and more.


Targeting TOD investments in Salt Lake City
With more than 60 light rail and commuter rail stations in its network, the Utah Transit Authority (UTA) needed help prioritizing the station locations where its TOD resources would have the greatest effect.
The project team used MapCraft Labs to build a tool that identifies station locations that exhibit high TOD readiness. The TOD readiness index incorporates factors related to market development potential, supportive zoning, existing density, demographics, affordable housing, and multimodal accessibility.
Stakeholders used the Lab to vary the weights of various attributes to see how the resulting composite score might reprioritize station areas within UTA’s TOD investment portfolio.
The TOD Readiness Lab makes it easy to see how changing the importance of one factor can affect investment priorities. Eventually UTA plans to share the information publicly on its website, with regular updates to reflect changing market conditions.


Assessing sustainable Bay Area growth strategies
When SPUR (the San Francisco Bay Area Planning and Urban Research Association) sought to understand how different policies could shape the Bay Area’s growth in more sustainable ways, they turned to MapCraft to produce a long-range land change model for evaluating potential future growth across 2,200,000 parcels in the region. SPUR’s Regional Strategy process, a multiyear stakeholder-led initiative, set out to develop a vision for the Bay Area in the year 2070, along with the policy strategies needed to make it a reality. Stakeholders sought solutions to the region’s environmental concerns, the racial wealth and well-being gap, unsustainable growth patterns, and housing challenges.
SPUR relied on MapCraft to test policies, both individually and simultaneously, to understand how various policy packages could best achieve SPUR’s regional growth principles. MapCraft ran hundreds of real estate pro formas on each parcel to evaluate how land use outcomes might differ due to:
Zoning map and code changes;
VMT-based development fees;
Major transit investments;
Value capture for affordable housing;
Parking demand reductions due to transit and fleet vehicle uptake;
New timber and modular building technologies; and
Other land use policies.
MapCraft’s modeling approach allowed SPUR to understand how policy interventions would influence land use as measured by: (a) concentration of land use change in resilient locations not subject to fire, sea level rise, and other factors; (b) avoidance of land use change in agricultural lands, ecological habitats, and open spaces; (c) delivery in walkable and transit-supportive urban forms; and (d) sufficiency of housing availability, scale, and affordability.
In May 2021, SPUR published their Civic Vision for Growth, identifying a package of policies to promote an equitable and sustainable region.

